Indicator Gauge Icon Legend
Legend Colors
Red is bad, green is good, blue is not statistically different/neutral.
Compared to Distribution
 the value is in the best half of communities.
 the value is in the 2nd worst quarter of communities.
 the value is in the worst quarter of communities.
Compared to Target
 meets target;
  does not meet target.
Compared to a Single Value
 lower than the comparison value;
 higher than the comparison value;
 not statistically different from comparison value.
Trend

 non-significant change over time;
 significant change over time;
  no change over time.
Compared to Prior Value
 higher than the previous measurement period;
 lower than the previous measurement period;
 no statistically different change from previous measurement period.
 Significantly better than the overall value
 Significantly worse than the overall value
 No significant difference with the overall value
 No data on significance available
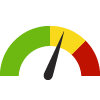
Children Healthy Weight (Ages 5-17)
County: Kane
Measurement Period: 2018
This indicator is archived and is no longer being updated. Click to learn more
Asked of all survey respondents with children ages 2-17 years: About how tall is your child without shoes? And how much does your child weigh without shoes?
Why is this important?
Obese children are more likely to have high blood pressure, high cholesterol, type 2 diabetes, breathing problems, joint problems, and chronic conditions. Obese children and adolescents have a greater risk of social and psychological problems such as discrimination and poor self-esteem. Obese children are also more likely to become obese adults.
52.8%
Source:
Community Health Needs Assessment
Measurement period: 2018
Maintained by: Kane County Health Department
Last update: December 2018
Measurement period: 2018
Maintained by: Kane County Health Department
Last update: December 2018
Compared to


Graph Selections

View maps, graphs, and tables for this indicator by selecting other location types (above).
Data Source
- Community Health Needs Assessment
Maintained By: Kane County Health Department
Filed under: Health / Children's Health, Health / Weight Status, Health Status, Children