Indicator Gauge Icon Legend
Legend Colors
Red is bad, green is good, blue is not statistically different/neutral.
Compared to Distribution
 the value is in the best half of communities.
 the value is in the 2nd worst quarter of communities.
 the value is in the worst quarter of communities.
Compared to Target
 meets target;
  does not meet target.
Compared to a Single Value
 lower than the comparison value;
 higher than the comparison value;
 not statistically different from comparison value.
Trend

 non-significant change over time;
 significant change over time;
  no change over time.
Compared to Prior Value
 higher than the previous measurement period;
 lower than the previous measurement period;
 no statistically different change from previous measurement period.
 Significantly better than the overall value
 Significantly worse than the overall value
 No significant difference with the overall value
 No data on significance available
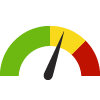
Drinking and Driving in the Past Month
County: Kane
Measurement Period: 2018
This indicator is archived and is no longer being updated. Click to learn more
Asked of all survey respondents: Considering all types of alcoholic beverages, how many times during the past 30 days did you have 4-5 or more drinks on an occasion?
With this in mind, during the past 30 days, how many times have you driven when you’ve had perhaps too much to drink?
With this in mind, during the past 30 days, how many times have you driven when you’ve had perhaps too much to drink?
Why is this important?
In 2014, 9,967 people were killed in alcohol-impaired driving crashes, accounting for nearly one-third (31%) of all traffic-related deaths in the United States. Every day, 28 people in the United States die in motor vehicle crashes that involve an alcohol-impaired driver. This amounts to one death every 53 minutes. Every year the cost of alcohol-related crashes totals more than $44 billion.
7.8%
Source:
Community Health Needs Assessment
Measurement period: 2018
Maintained by: Kane County Health Department
Last update: December 2018
Measurement period: 2018
Maintained by: Kane County Health Department
Last update: December 2018
Compared to


Graph Selections

View maps, graphs, and tables for this indicator by selecting other location types (above).
Data Source
- Community Health Needs Assessment
Maintained By: Kane County Health Department
Filed under: Health / Alcohol & Drug Use, Community / Public Safety, Health Behaviors, Adults