Indicator Gauge Icon Legend
Legend Colors
Red is bad, green is good, blue is not statistically different/neutral.
Compared to Distribution
 the value is in the best half of communities.
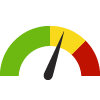 the value is in the 2nd worst quarter of communities.
 the value is in the worst quarter of communities.
Compared to Target
 meets target;
  does not meet target.
Compared to a Single Value
 lower than the comparison value;
 higher than the comparison value;
 not statistically different from comparison value.
Trend

 non-significant change over time;
 significant change over time;
  no change over time.
Compared to Prior Value
 higher than the previous measurement period;
 lower than the previous measurement period;
 no statistically different change from previous measurement period.
 Significantly better than the overall value
 Significantly worse than the overall value
 No significant difference with the overall value
 No data on significance available
Healthy Weight (BMI 18.5-24.9)
County: Kane
Measurement Period: 2018
This indicator is archived and is no longer being updated. Click to learn more
Asked of all survey respondents: About how much do you weigh without shoes? About how tall are you without shoes?
Why is this important?
The percentage of healthy weight adults is an indicator of the overall health and lifestyle of a community. Staying in control of your weight contributes to good health now and as you age. As people age, their body composition gradually shifts — the proportion of muscle decreases and the proportion of fat increases. This shift slows their metabolism, making it easier to gain weight. In addition, some people become less physically active as they get older, increasing the risk of weight gain. Weight gain can be prevented by choosing a lifestyle that includes good eating habits and daily physical activity. By avoiding weight gain, you avoid higher risks of many chronic diseases, such as heart disease, stroke, type 2 diabetes, high blood pressure, osteoarthritis, and some forms of cancer.
29.6%
Source:
Community Health Needs Assessment
Measurement period: 2018
Maintained by: Kane County Health Department
Last update: December 2018
Measurement period: 2018
Maintained by: Kane County Health Department
Last update: December 2018
Compared to


Graph Selections

View maps, graphs, and tables for this indicator by selecting other location types (above).
Data Source
- Community Health Needs Assessment
Maintained By: Kane County Health Department
Filed under: Health / Weight Status, Health Status, Adults