Search for Indicators
Community Health Needs Assessment Survey
The 2014 Community Health Needs Assessment survey was conducted by Professional Research Consultants, Inc. (PRC). There were 1,084 participants in the survey (adults aged 18 years and older), which was conducted via both landline and cell phone interviews in English and Spanish. The survey results were adjusted to match the geographic distribution and demographic characteristics of the population surveyed, as determined by the 2010 U.S. Census. Geographic areas for respondent data are based on only the Kane County portion of ZIP codes within the Kane County planning areas.
The survey was largely based on the Behavioral Risk Factor Surveillance System (BRFSS) survey conducted by the Centers for Disease Control and Prevention (CDC) in addition to other public health surveys and other customized questions agreed upon by PRC and sponsoring community partners.
The 2014 Community Health Needs Assessment survey was part of a larger project conducted via collaboration of multiple community partners in Kane County, including: 708 INC Board, Advocate Sherman Hospital, Northwestern Delnor Hospital, Kane County Health Department, Presence Mercy Medical Center, Presence Saint Joseph Hospital, and Rush-Copley Medical Center.
Additional information regarding this survey, and other health assessments conducted in Kane County, may be found at the Community Health Needs Assessment 2014 Comprehensive Website.
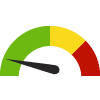
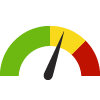
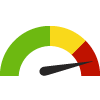
Indicator Gauge Icon Legend
Legend Colors
Red is bad, green is good, blue is not statistically different/neutral.
Compared to Distribution
 the value is in the best half of communities.
 the value is in the 2nd worst quarter of communities.
 the value is in the worst quarter of communities.
Compared to Target
 meets target;
  does not meet target.
Compared to a Single Value
 lower than the comparison value;
 higher than the comparison value;
 not statistically different from comparison value.
Trend

 non-significant change over time;
 significant change over time;
  no change over time.
Compared to Prior Value
 higher than the previous measurement period;
 lower than the previous measurement period;
 no statistically different change from previous measurement period.
 Significantly better than the overall value
 Significantly worse than the overall value
 Significantly different than the overall value
 No significant difference with the overall value
 No data on significance available
Health / Alcohol & Drug Use
Binge Drinker County: Kane
Binge Drinker County: Kane
26.5%
(2018)
Compared to:


IL Value
(19.9%)
The regional value is compared to the Illinois State value.
US Value
(20.0%)
The regional value is compared to the national value.
Prior Value
(16.2%)
Prior Value compares a measured value with the previously measured value. Confidence intervals were not taken into account in determining the direction of the comparison.
Binge Drinker Planning Area: Central
Binge Drinker Planning Area: Central
23.0%
(2018)
Compared to:
US Value
(20.0%)
The regional value is compared to the national value.
Prior Value
(15.8%)
Prior Value compares a measured value with the previously measured value. Confidence intervals were not taken into account in determining the direction of the comparison.
Binge Drinker Planning Area: North
Binge Drinker Planning Area: North
27.9%
(2018)
Compared to:
US Value
(20.0%)
The regional value is compared to the national value.
Prior Value
(18.6%)
Prior Value compares a measured value with the previously measured value. Confidence intervals were not taken into account in determining the direction of the comparison.
Binge Drinker Planning Area: South
Binge Drinker Planning Area: South
26.7%
(2018)
Compared to:
US Value
(20.0%)
The regional value is compared to the national value.
Prior Value
(13.7%)
Prior Value compares a measured value with the previously measured value. Confidence intervals were not taken into account in determining the direction of the comparison.
Chronic Drinker County: Kane
Chronic Drinker County: Kane
3.7%
(2014)
Compared to:
US Value
(5.2%)
The U.S. value is taken from the 2013 PRC National Health Survey; the methodological approach for the national survey is identical to the approach for the 2014 Community Health Needs Assessment in Kane County.
Chronic Drinker Planning Area: Central
Chronic Drinker Planning Area: Central
5.4%
(2014)
Compared to:
US Value
(5.2%)
The U.S. value is taken from the 2013 PRC National Health Survey; the methodological approach for the national survey is identical to the approach for the 2014 Community Health Needs Assessment in Kane County.
Chronic Drinker Planning Area: North
Chronic Drinker Planning Area: North
3.5%
(2014)
Compared to:
US Value
(5.2%)
The U.S. value is taken from the 2013 PRC National Health Survey; the methodological approach for the national survey is identical to the approach for the 2014 Community Health Needs Assessment in Kane County.
Chronic Drinker Planning Area: South
Chronic Drinker Planning Area: South
3.1%
(2014)
Compared to:
US Value
(5.2%)
The U.S. value is taken from the 2013 PRC National Health Survey; the methodological approach for the national survey is identical to the approach for the 2014 Community Health Needs Assessment in Kane County.
Current Drinker County: Kane
Current Drinker County: Kane
65.0%
(2018)
Compared to:
US Value
(56.5% in 2014)
The U.S. value is taken from the 2013 PRC National Health Survey; the methodological approach for the national survey is identical to the approach for the 2014 Community Health Needs Assessment in Kane County.
Prior Value
(61.9%)
Prior Value compares a measured value with the previously measured value. Confidence intervals were not taken into account in determining the direction of the comparison.
Current Drinker Planning Area: Central
Current Drinker Planning Area: Central
67.0%
(2018)
Compared to:
US Value
(56.5% in 2014)
The U.S. value is taken from the 2013 PRC National Health Survey; the methodological approach for the national survey is identical to the approach for the 2014 Community Health Needs Assessment in Kane County.
Prior Value
(69.7%)
Prior Value compares a measured value with the previously measured value. Confidence intervals were not taken into account in determining the direction of the comparison.
Current Drinker Planning Area: North
Current Drinker Planning Area: North
64.2%
(2018)
Compared to:
US Value
(56.5% in 2014)
The U.S. value is taken from the 2013 PRC National Health Survey; the methodological approach for the national survey is identical to the approach for the 2014 Community Health Needs Assessment in Kane County.
Prior Value
(67.6%)
Prior Value compares a measured value with the previously measured value. Confidence intervals were not taken into account in determining the direction of the comparison.
Current Drinker Planning Area: South
Current Drinker Planning Area: South
64.9%
(2018)
Compared to:
US Value
(56.5% in 2014)
The U.S. value is taken from the 2013 PRC National Health Survey; the methodological approach for the national survey is identical to the approach for the 2014 Community Health Needs Assessment in Kane County.
Prior Value
(52.3%)
Prior Value compares a measured value with the previously measured value. Confidence intervals were not taken into account in determining the direction of the comparison.
Drinking and Driving in the Past Month County: Kane
Drinking and Driving in the Past Month County: Kane
7.8%
(2018)
Compared to:
IL Value
(3.8%)
The regional value is compared to the Illinois State value.
US Value
(5.2%)
The regional value is compared to the national value.
Prior Value
(1.4%)
Prior Value compares a measured value with the previously measured value. Confidence intervals were not taken into account in determining the direction of the comparison.
Drinking and Driving in the Past Month Planning Area: Central
Drinking and Driving in the Past Month Planning Area: Central
4.2%
(2018)
Compared to:
US Value
(5.2%)
The regional value is compared to the national value.
Prior Value
(1.0%)
Prior Value compares a measured value with the previously measured value. Confidence intervals were not taken into account in determining the direction of the comparison.
Drinking and Driving in the Past Month Planning Area: North
Drinking and Driving in the Past Month Planning Area: North
8.6%
(2018)
Compared to:
US Value
(5.2%)
The regional value is compared to the national value.
Prior Value
(1.8%)
Prior Value compares a measured value with the previously measured value. Confidence intervals were not taken into account in determining the direction of the comparison.
Drinking and Driving in the Past Month Planning Area: South
Drinking and Driving in the Past Month Planning Area: South
8.5%
(2018)
Compared to:
US Value
(5.2%)
The regional value is compared to the national value.
Prior Value
(1.0%)
Prior Value compares a measured value with the previously measured value. Confidence intervals were not taken into account in determining the direction of the comparison.
Health / Cancer
Colorectal Cancer Screening (Age 50-75) County: Kane
Colorectal Cancer Screening (Age 50-75) County: Kane
75.1%
(2018)
Compared to:

IL Value
(63.5%)
The regional value is compared to the Illinois State value.
US Value
(76.4%)
The regional value is compared to the national value.
Prior Value
(73.0%)
Prior Value compares a measured value with the previously measured value. Confidence intervals were not taken into account in determining the direction of the comparison.
Colorectal Cancer Screening (Age 50-75) Planning Area: Central
Colorectal Cancer Screening (Age 50-75) Planning Area: Central
72.8%
(2018)
Compared to:
US Value
(76.4%)
The regional value is compared to the national value.
Prior Value
(63.2%)
Prior Value compares a measured value with the previously measured value. Confidence intervals were not taken into account in determining the direction of the comparison.
Colorectal Cancer Screening (Age 50-75) Planning Area: North
Colorectal Cancer Screening (Age 50-75) Planning Area: North
77.0%
(2018)
Compared to:
US Value
(76.4%)
The regional value is compared to the national value.
Prior Value
(74.0%)
Prior Value compares a measured value with the previously measured value. Confidence intervals were not taken into account in determining the direction of the comparison.
Colorectal Cancer Screening (Age 50-75) Planning Area: South
Colorectal Cancer Screening (Age 50-75) Planning Area: South
74.4%
(2018)
Compared to:

US Value
(76.4%)
The regional value is compared to the national value.
Prior Value
(76.1%)
Prior Value compares a measured value with the previously measured value. Confidence intervals were not taken into account in determining the direction of the comparison.
Pap Smear in Past 3 Years (Women ages 21-65) County: Kane
Pap Smear in Past 3 Years (Women ages 21-65) County: Kane
79.6%
(2018)
Compared to:
IL Value
(83.8%)
The regional value is compared to the Illinois State value.
US Value
(73.5%)
The regional value is compared to the national value.
Prior Value
(85.7%)
Prior Value compares a measured value with the previously measured value. Confidence intervals were not taken into account in determining the direction of the comparison.
Pap Smear in Past 3 Years (Women ages 21-65) Planning Area: Central
Pap Smear in Past 3 Years (Women ages 21-65) Planning Area: Central
81.5%
(2018)
Compared to:
US Value
(73.5%)
The regional value is compared to the national value.
Prior Value
(83.2%)
Prior Value compares a measured value with the previously measured value. Confidence intervals were not taken into account in determining the direction of the comparison.
Pap Smear in Past 3 Years (Women ages 21-65) Planning Area: North
Pap Smear in Past 3 Years (Women ages 21-65) Planning Area: North
82.2%
(2018)
Compared to:
US Value
(73.5%)
The regional value is compared to the national value.
Prior Value
(85.9%)
Prior Value compares a measured value with the previously measured value. Confidence intervals were not taken into account in determining the direction of the comparison.
Pap Smear in Past 3 Years (Women ages 21-65) Planning Area: South
Pap Smear in Past 3 Years (Women ages 21-65) Planning Area: South
76.8%
(2018)
Compared to:
US Value
(73.5%)
The regional value is compared to the national value.
Prior Value
(86.3%)
Prior Value compares a measured value with the previously measured value. Confidence intervals were not taken into account in determining the direction of the comparison.
PSA Test in Past 2 Years (Men ages 40+) County: Kane
PSA Test in Past 2 Years (Men ages 40+) County: Kane
54.5%
(2018)
Compared to:
US Value
(55.0% in 2014)
The U.S. value is taken from the 2013 PRC National Health Survey; the methodological approach for the national survey is identical to the approach for the 2014 Community Health Needs Assessment in Kane County.
Prior Value
(59.6%)
Prior Value compares a measured value with the previously measured value. Confidence intervals were not taken into account in determining the direction of the comparison.
PSA Test in Past 2 Years (Men ages 40+) Planning Area: Central
PSA Test in Past 2 Years (Men ages 40+) Planning Area: Central
57.3%
(2018)
Compared to:
US Value
(55.0% in 2014)
The U.S. value is taken from the 2013 PRC National Health Survey; the methodological approach for the national survey is identical to the approach for the 2014 Community Health Needs Assessment in Kane County.
Prior Value
(59.1%)
Prior Value compares a measured value with the previously measured value. Confidence intervals were not taken into account in determining the direction of the comparison.
PSA Test in Past 2 Years (Men ages 40+) Planning Area: North
PSA Test in Past 2 Years (Men ages 40+) Planning Area: North
60.0%
(2018)
Compared to:
US Value
(55.0% in 2014)
The U.S. value is taken from the 2013 PRC National Health Survey; the methodological approach for the national survey is identical to the approach for the 2014 Community Health Needs Assessment in Kane County.
Prior Value
(60.9%)
Prior Value compares a measured value with the previously measured value. Confidence intervals were not taken into account in determining the direction of the comparison.
PSA Test in Past 2 Years (Men ages 40+) Planning Area: South
PSA Test in Past 2 Years (Men ages 40+) Planning Area: South
48.2%
(2018)
Compared to:
US Value
(55.0% in 2014)
The U.S. value is taken from the 2013 PRC National Health Survey; the methodological approach for the national survey is identical to the approach for the 2014 Community Health Needs Assessment in Kane County.
Prior Value
(58.0%)
Prior Value compares a measured value with the previously measured value. Confidence intervals were not taken into account in determining the direction of the comparison.
Health / Children's Health
Children Healthy Weight (Ages 5-17) County: Kane
Children Healthy Weight (Ages 5-17) County: Kane
52.8%
(2018)
Compared to:
US Value
(58.4%)
The regional value is compared to the national value.
Prior Value
(62.7%)
Prior Value compares a measured value with the previously measured value. Confidence intervals were not taken into account in determining the direction of the comparison.
Children Healthy Weight (Ages 5-17) Planning Area: Central
Children Healthy Weight (Ages 5-17) Planning Area: Central
68.0%
(2018)
Compared to:
US Value
(58.4%)
The regional value is compared to the national value.
Prior Value
(65.3%)
Prior Value compares a measured value with the previously measured value. Confidence intervals were not taken into account in determining the direction of the comparison.
Children Healthy Weight (Ages 5-17) Planning Area: North
Children Healthy Weight (Ages 5-17) Planning Area: North
48.6%
(2018)
Compared to:
US Value
(58.4%)
The regional value is compared to the national value.
Prior Value
(62.2%)
Prior Value compares a measured value with the previously measured value. Confidence intervals were not taken into account in determining the direction of the comparison.
Children Healthy Weight (Ages 5-17) Planning Area: South
Children Healthy Weight (Ages 5-17) Planning Area: South
50.6%
(2018)
Compared to:
US Value
(58.4%)
The regional value is compared to the national value.
Prior Value
(62.2%)
Prior Value compares a measured value with the previously measured value. Confidence intervals were not taken into account in determining the direction of the comparison.
Children Obese (Ages 5-17) (95th Percentile) County: Kane
Children Obese (Ages 5-17) (95th Percentile) County: Kane
24.5%
(2018)
Compared to:
US Value
(20.4%)
The regional value is compared to the national value.
Prior Value
(16.3%)
Prior Value compares a measured value with the previously measured value. Confidence intervals were not taken into account in determining the direction of the comparison.
Children Obese (Ages 5-17) (95th Percentile) Planning Area: Central
Children Obese (Ages 5-17) (95th Percentile) Planning Area: Central
11.3%
(2018)
Compared to:
US Value
(20.4%)
The regional value is compared to the national value.
Prior Value
(13.5%)
Prior Value compares a measured value with the previously measured value. Confidence intervals were not taken into account in determining the direction of the comparison.
Children Obese (Ages 5-17) (95th Percentile) Planning Area: North
Children Obese (Ages 5-17) (95th Percentile) Planning Area: North
24.7%
(2018)
Compared to:
US Value
(20.4%)
The regional value is compared to the national value.
Prior Value
(12.0%)
Prior Value compares a measured value with the previously measured value. Confidence intervals were not taken into account in determining the direction of the comparison.
Children Obese (Ages 5-17) (95th Percentile) Planning Area: South
Children Obese (Ages 5-17) (95th Percentile) Planning Area: South
29.1%
(2018)
Compared to:
US Value
(20.4%)
The regional value is compared to the national value.
Prior Value
(22.7%)
Prior Value compares a measured value with the previously measured value. Confidence intervals were not taken into account in determining the direction of the comparison.
Children Overweight (Ages 5-17) (85th Percentile) County: Kane
Children Overweight (Ages 5-17) (85th Percentile) County: Kane
36.9%
(2018)
Compared to:
US Value
(33.0%)
The regional value is compared to the national value.
Prior Value
(27.6%)
Prior Value compares a measured value with the previously measured value. Confidence intervals were not taken into account in determining the direction of the comparison.
Children Overweight (Ages 5-17) (85th Percentile) Planning Area: Central
Children Overweight (Ages 5-17) (85th Percentile) Planning Area: Central
13.9%
(2018)
Compared to:
US Value
(33.0%)
The regional value is compared to the national value.
Prior Value
(21.6%)
Prior Value compares a measured value with the previously measured value. Confidence intervals were not taken into account in determining the direction of the comparison.
Children Overweight (Ages 5-17) (85th Percentile) Planning Area: North
Children Overweight (Ages 5-17) (85th Percentile) Planning Area: North
41.3%
(2018)
Compared to:
US Value
(33.0%)
The regional value is compared to the national value.
Prior Value
(25.5%)
Prior Value compares a measured value with the previously measured value. Confidence intervals were not taken into account in determining the direction of the comparison.
Children Overweight (Ages 5-17) (85th Percentile) Planning Area: South
Children Overweight (Ages 5-17) (85th Percentile) Planning Area: South
41.7%
(2018)
Compared to:
US Value
(33.0%)
The regional value is compared to the national value.
Prior Value
(32.9%)
Prior Value compares a measured value with the previously measured value. Confidence intervals were not taken into account in determining the direction of the comparison.
Currently Has Asthma (Children Ages 2-17) County: Kane
Currently Has Asthma (Children Ages 2-17) County: Kane
4.5%
(2018)
Compared to:
US Value
(11.1%)
The regional value is compared to the national value.
Prior Value
(8.3%)
Prior Value compares a measured value with the previously measured value. Confidence intervals were not taken into account in determining the direction of the comparison.
Currently Has Asthma (Children Ages 2-17) Planning Area: Central
Currently Has Asthma (Children Ages 2-17) Planning Area: Central
3.6%
(2018)
Compared to:
US Value
(11.1%)
The regional value is compared to the national value.
Prior Value
(10.5%)
Prior Value compares a measured value with the previously measured value. Confidence intervals were not taken into account in determining the direction of the comparison.
Currently Has Asthma (Children Ages 2-17) Planning Area: North
Currently Has Asthma (Children Ages 2-17) Planning Area: North
5.8%
(2018)
Compared to:
US Value
(11.1%)
The regional value is compared to the national value.
Prior Value
(11.2%)
Prior Value compares a measured value with the previously measured value. Confidence intervals were not taken into account in determining the direction of the comparison.
Currently Has Asthma (Children Ages 2-17) Planning Area: South
Currently Has Asthma (Children Ages 2-17) Planning Area: South
3.8%
(2018)
Compared to:
US Value
(11.1%)
The regional value is compared to the national value.
Prior Value
(4.3%)
Prior Value compares a measured value with the previously measured value. Confidence intervals were not taken into account in determining the direction of the comparison.
Dental Visit in the Past Year (Ages 2-17) County: Kane
Dental Visit in the Past Year (Ages 2-17) County: Kane
85.5%
(2018)
Compared to:
US Value
(87.0%)
The regional value is compared to the national value.
Prior Value
(91.9%)
Prior Value compares a measured value with the previously measured value. Confidence intervals were not taken into account in determining the direction of the comparison.
Dental Visit in the Past Year (Ages 2-17) Planning Area: Central
Dental Visit in the Past Year (Ages 2-17) Planning Area: Central
94.3%
(2018)
Compared to:
US Value
(87.0%)
The regional value is compared to the national value.
Prior Value
(95.6%)
Prior Value compares a measured value with the previously measured value. Confidence intervals were not taken into account in determining the direction of the comparison.
Dental Visit in the Past Year (Ages 2-17) Planning Area: North
Dental Visit in the Past Year (Ages 2-17) Planning Area: North
88.0%
(2018)
Compared to:
US Value
(87.0%)
The regional value is compared to the national value.
Prior Value
(91.0%)
Prior Value compares a measured value with the previously measured value. Confidence intervals were not taken into account in determining the direction of the comparison.
Dental Visit in the Past Year (Ages 2-17) Planning Area: South
Dental Visit in the Past Year (Ages 2-17) Planning Area: South
80.3%
(2018)
Compared to:
US Value
(87.0%)
The regional value is compared to the national value.
Prior Value
(91.4%)
Prior Value compares a measured value with the previously measured value. Confidence intervals were not taken into account in determining the direction of the comparison.
Health / Diabetes
Borderline/Pre-Diabetes County: Kane
Borderline/Pre-Diabetes County: Kane
7.5%
(2018)
Compared to:
IL Value
(1.0%)
The regional value is compared to the Illinois State value.
US Value
(9.5%)
The regional value is compared to the national value.
Prior Value
(6.0%)
Prior Value compares a measured value with the previously measured value. Confidence intervals were not taken into account in determining the direction of the comparison.
Borderline/Pre-Diabetes Planning Area: Central
Borderline/Pre-Diabetes Planning Area: Central
4.4%
(2018)
Compared to:
US Value
(9.5%)
The regional value is compared to the national value.
Prior Value
(4.7%)
Prior Value compares a measured value with the previously measured value. Confidence intervals were not taken into account in determining the direction of the comparison.
Borderline/Pre-Diabetes Planning Area: North
Borderline/Pre-Diabetes Planning Area: North
9.9%
(2018)
Compared to:
US Value
(9.5%)
The regional value is compared to the national value.
Prior Value
(7.0%)
Prior Value compares a measured value with the previously measured value. Confidence intervals were not taken into account in determining the direction of the comparison.
Borderline/Pre-Diabetes Planning Area: South
Borderline/Pre-Diabetes Planning Area: South
6.6%
(2018)
Compared to:
US Value
(9.5%)
The regional value is compared to the national value.
Prior Value
(5.3%)
Prior Value compares a measured value with the previously measured value. Confidence intervals were not taken into account in determining the direction of the comparison.
Diabetes/High Blood Sugar County: Kane
Diabetes/High Blood Sugar County: Kane
11.1%
(2018)
Compared to:
IL Value
(10.4%)
The regional value is compared to the Illinois State value.
US Value
(13.3%)
The regional value is compared to the national value.
Prior Value
(9.4%)
Prior Value compares a measured value with the previously measured value. Confidence intervals were not taken into account in determining the direction of the comparison.
Diabetes/High Blood Sugar Planning Area: Central
Diabetes/High Blood Sugar Planning Area: Central
10.3%
(2018)
Compared to:
US Value
(13.3%)
The regional value is compared to the national value.
Prior Value
(6.9%)
Prior Value compares a measured value with the previously measured value. Confidence intervals were not taken into account in determining the direction of the comparison.
Diabetes/High Blood Sugar Planning Area: North
Diabetes/High Blood Sugar Planning Area: North
12.2%
(2018)
Compared to:
US Value
(13.3%)
The regional value is compared to the national value.
Prior Value
(6.4%)
Prior Value compares a measured value with the previously measured value. Confidence intervals were not taken into account in determining the direction of the comparison.
Diabetes/High Blood Sugar Planning Area: South
Diabetes/High Blood Sugar Planning Area: South
10.2%
(2018)
Compared to:
US Value
(13.3%)
The regional value is compared to the national value.
Prior Value
(13.9%)
Prior Value compares a measured value with the previously measured value. Confidence intervals were not taken into account in determining the direction of the comparison.
Health / Health Care Access & Quality
Eye Exam in the Past Two Years County: Kane
Eye Exam in the Past Two Years County: Kane
58.3%
(2018)
Compared to:
US Value
(55.3%)
The regional value is compared to the national value.
Prior Value
(56.2%)
Prior Value compares a measured value with the previously measured value. Confidence intervals were not taken into account in determining the direction of the comparison.
Eye Exam in the Past Two Years Planning Area: Central
Eye Exam in the Past Two Years Planning Area: Central
63.5%
(2018)
Compared to:
US Value
(55.3%)
The regional value is compared to the national value.
Prior Value
(61.8%)
Prior Value compares a measured value with the previously measured value. Confidence intervals were not taken into account in determining the direction of the comparison.
Eye Exam in the Past Two Years Planning Area: North
Eye Exam in the Past Two Years Planning Area: North
55.2%
(2018)
Compared to:
US Value
(55.3%)
The regional value is compared to the national value.
Prior Value
(57.6%)
Prior Value compares a measured value with the previously measured value. Confidence intervals were not taken into account in determining the direction of the comparison.
Eye Exam in the Past Two Years Planning Area: South
Eye Exam in the Past Two Years Planning Area: South
59.0%
(2018)
Compared to:
US Value
(55.3%)
The regional value is compared to the national value.
Prior Value
(52.3%)
Prior Value compares a measured value with the previously measured value. Confidence intervals were not taken into account in determining the direction of the comparison.
Health / Heart Disease & Stroke
Ever Told Have High Blood Pressure (HBP) County: Kane
Ever Told Have High Blood Pressure (HBP) County: Kane
32.3%
(2018)
Compared to:
IL Value
(30.8%)
The regional value is compared to the Illinois State value.
US Value
(37.0%)
The regional value is compared to the national value.
Prior Value
(32.2%)
Prior Value compares a measured value with the previously measured value. Confidence intervals were not taken into account in determining the direction of the comparison.
Ever Told Have High Blood Pressure (HBP) Planning Area: Central
Ever Told Have High Blood Pressure (HBP) Planning Area: Central
30.1%
(2018)
Compared to:
US Value
(37.0%)
The regional value is compared to the national value.
Prior Value
(33.6%)
Prior Value compares a measured value with the previously measured value. Confidence intervals were not taken into account in determining the direction of the comparison.
Ever Told Have High Blood Pressure (HBP) Planning Area: North
Ever Told Have High Blood Pressure (HBP) Planning Area: North
34.8%
(2018)
Compared to:
US Value
(37.0%)
The regional value is compared to the national value.
Prior Value
(28.6%)
Prior Value compares a measured value with the previously measured value. Confidence intervals were not taken into account in determining the direction of the comparison.
Ever Told Have High Blood Pressure (HBP) Planning Area: South
Ever Told Have High Blood Pressure (HBP) Planning Area: South
30.9%
(2018)
Compared to:
US Value
(37.0%)
The regional value is compared to the national value.
Prior Value
(36.0%)
Prior Value compares a measured value with the previously measured value. Confidence intervals were not taken into account in determining the direction of the comparison.
Ever told Have High Cholesterol (HBC) County: Kane
Ever told Have High Cholesterol (HBC) County: Kane
29.4%
(2018)
Compared to:
US Value
(36.2%)
The regional value is compared to the national value.
Prior Value
(32.6%)
Prior Value compares a measured value with the previously measured value. Confidence intervals were not taken into account in determining the direction of the comparison.
Ever told Have High Cholesterol (HBC) Planning Area: Central
Ever told Have High Cholesterol (HBC) Planning Area: Central
31.1%
(2018)
Compared to:
US Value
(36.2%)
The regional value is compared to the national value.
Prior Value
(30.3%)
Prior Value compares a measured value with the previously measured value. Confidence intervals were not taken into account in determining the direction of the comparison.
Ever told Have High Cholesterol (HBC) Planning Area: North
Ever told Have High Cholesterol (HBC) Planning Area: North
29.5%
(2018)
Compared to:
US Value
(36.2%)
The regional value is compared to the national value.
Prior Value
(35.4%)
Prior Value compares a measured value with the previously measured value. Confidence intervals were not taken into account in determining the direction of the comparison.
Ever told Have High Cholesterol (HBC) Planning Area: South
Ever told Have High Cholesterol (HBC) Planning Area: South
28.7%
(2018)
Compared to:
US Value
(36.2%)
The regional value is compared to the national value.
Prior Value
(30.3%)
Prior Value compares a measured value with the previously measured value. Confidence intervals were not taken into account in determining the direction of the comparison.
Health / Heart Disease & Stroke
Heart Disease (Heart Attack, Angina, Coronary Disease)
Value
Compared to:
Heart Disease (Heart Attack, Angina, Coronary Disease) County: Kane
Heart Disease (Heart Attack, Angina, Coronary Disease) County: Kane
4.4%
(2018)
Compared to:
US Value
(8.0%)
The regional value is compared to the national value.
Prior Value
(5.9%)
Prior Value compares a measured value with the previously measured value. Confidence intervals were not taken into account in determining the direction of the comparison.
Heart Disease (Heart Attack, Angina, Coronary Disease) Planning Area: Central
Heart Disease (Heart Attack, Angina, Coronary Disease) Planning Area: Central
4.5%
(2018)
Compared to:
US Value
(8.0%)
The regional value is compared to the national value.
Prior Value
(4.2%)
Prior Value compares a measured value with the previously measured value. Confidence intervals were not taken into account in determining the direction of the comparison.
Heart Disease (Heart Attack, Angina, Coronary Disease) Planning Area: North
Heart Disease (Heart Attack, Angina, Coronary Disease) Planning Area: North
5.5%
(2018)
Compared to:
US Value
(8.0%)
The regional value is compared to the national value.
Prior Value
(6.6%)
Prior Value compares a measured value with the previously measured value. Confidence intervals were not taken into account in determining the direction of the comparison.
Heart Disease (Heart Attack, Angina, Coronary Disease) Planning Area: South
Heart Disease (Heart Attack, Angina, Coronary Disease) Planning Area: South
3.3%
(2018)
Compared to:
US Value
(8.0%)
The regional value is compared to the national value.
Prior Value
(5.7%)
Prior Value compares a measured value with the previously measured value. Confidence intervals were not taken into account in determining the direction of the comparison.
Stroke County: Kane
Stroke County: Kane
1.8%
(2018)
Compared to:
IL Value
(3.1%)
The regional value is compared to the Illinois State value.
US Value
(4.7%)
The regional value is compared to the national value.
Prior Value
(1.7%)
Prior Value compares a measured value with the previously measured value. Confidence intervals were not taken into account in determining the direction of the comparison.
Stroke Planning Area: Central
Stroke Planning Area: Central
1.0%
(2018)
Compared to:
US Value
(4.7%)
The regional value is compared to the national value.
Prior Value
(1.4%)
Prior Value compares a measured value with the previously measured value. Confidence intervals were not taken into account in determining the direction of the comparison.
Stroke Planning Area: North
Stroke Planning Area: North
3.4%
(2018)
Compared to:
US Value
(4.7%)
The regional value is compared to the national value.
Prior Value
(1.3%)
Prior Value compares a measured value with the previously measured value. Confidence intervals were not taken into account in determining the direction of the comparison.
Stroke Planning Area: South
Stroke Planning Area: South
0.6%
(2018)
Compared to:
US Value
(4.7%)
The regional value is compared to the national value.
Prior Value
(2.4%)
Prior Value compares a measured value with the previously measured value. Confidence intervals were not taken into account in determining the direction of the comparison.
Health / Immunizations & Infectious Diseases
Health / Immunizations & Infectious Diseases
Flu Vaccine in the Past Year (Ages 65+)
Value
Compared to:
Flu Vaccine in the Past Year (Ages 65+) County: Kane
Flu Vaccine in the Past Year (Ages 65+) County: Kane
75.8%
(2018)
Compared to:
IL Value
(56.4%)
The regional value is compared to the Illinois State value.
US Value
(76.8%)
The regional value is compared to the national value.
Prior Value
(55.0%)
Prior Value compares a measured value with the previously measured value. Confidence intervals were not taken into account in determining the direction of the comparison.
Flu Vaccine in the Past Year (Ages 65+) Planning Area: Central
Flu Vaccine in the Past Year (Ages 65+) Planning Area: Central
75.1%
(2018)
Compared to:
US Value
(76.8%)
The regional value is compared to the national value.
Prior Value
(48.7%)
Prior Value compares a measured value with the previously measured value. Confidence intervals were not taken into account in determining the direction of the comparison.
Flu Vaccine in the Past Year (Ages 65+) Planning Area: North
Flu Vaccine in the Past Year (Ages 65+) Planning Area: North
75.6%
(2018)
Compared to:
US Value
(76.8%)
The regional value is compared to the national value.
Prior Value
(54.8%)
Prior Value compares a measured value with the previously measured value. Confidence intervals were not taken into account in determining the direction of the comparison.
Flu Vaccine in the Past Year (Ages 65+) Planning Area: South
Flu Vaccine in the Past Year (Ages 65+) Planning Area: South
76.6%
(2018)
Compared to:
US Value
(76.8%)
The regional value is compared to the national value.
Prior Value
(58.7%)
Prior Value compares a measured value with the previously measured value. Confidence intervals were not taken into account in determining the direction of the comparison.
Health / Immunizations & Infectious Diseases
Flu Vaccine in the Past Year (High Risk Ages 18-64)
Value
Compared to:
Flu Vaccine in the Past Year (High Risk Ages 18-64) County: Kane
Flu Vaccine in the Past Year (High Risk Ages 18-64) County: Kane
52.6%
(2018)
Compared to:
US Value
(55.7%)
The regional value is compared to the national value.
Prior Value
(36.7%)
Prior Value compares a measured value with the previously measured value. Confidence intervals were not taken into account in determining the direction of the comparison.
Flu Vaccine in the Past Year (High Risk Ages 18-64) Planning Area: Central
Flu Vaccine in the Past Year (High Risk Ages 18-64) Planning Area: Central
62.9%
(2018)
Compared to:
US Value
(55.7%)
The regional value is compared to the national value.
Prior Value
(39.1%)
Prior Value compares a measured value with the previously measured value. Confidence intervals were not taken into account in determining the direction of the comparison.
Flu Vaccine in the Past Year (High Risk Ages 18-64) Planning Area: North
Flu Vaccine in the Past Year (High Risk Ages 18-64) Planning Area: North
44.7%
(2018)
Compared to:
US Value
(55.7%)
The regional value is compared to the national value.
Prior Value
(28.4%)
Prior Value compares a measured value with the previously measured value. Confidence intervals were not taken into account in determining the direction of the comparison.
Flu Vaccine in the Past Year (High Risk Ages 18-64) Planning Area: South
Flu Vaccine in the Past Year (High Risk Ages 18-64) Planning Area: South
56.6%
(2018)
Compared to:
US Value
(55.7%)
The regional value is compared to the national value.
Prior Value
(44.6%)
Prior Value compares a measured value with the previously measured value. Confidence intervals were not taken into account in determining the direction of the comparison.
Health / Immunizations & Infectious Diseases
HIV Test in the Past Year (Age 18-44)
Value
Compared to:
HIV Test in the Past Year (Age 18-44) County: Kane
HIV Test in the Past Year (Age 18-44) County: Kane
19.8%
(2018)
Compared to:
US Value
(24.7%)
The regional value is compared to the national value.
Prior Value
(19.1%)
Prior Value compares a measured value with the previously measured value. Confidence intervals were not taken into account in determining the direction of the comparison.
HIV Test in the Past Year (Age 18-44) Planning Area: Central
HIV Test in the Past Year (Age 18-44) Planning Area: Central
20.5%
(2018)
Compared to:
US Value
(24.7%)
The regional value is compared to the national value.
Prior Value
(18.6%)
Prior Value compares a measured value with the previously measured value. Confidence intervals were not taken into account in determining the direction of the comparison.
HIV Test in the Past Year (Age 18-44) Planning Area: North
HIV Test in the Past Year (Age 18-44) Planning Area: North
13.4%
(2018)
Compared to:
US Value
(24.7%)
The regional value is compared to the national value.
Prior Value
(17.9%)
Prior Value compares a measured value with the previously measured value. Confidence intervals were not taken into account in determining the direction of the comparison.
HIV Test in the Past Year (Age 18-44) Planning Area: South
HIV Test in the Past Year (Age 18-44) Planning Area: South
25.0%
(2018)
Compared to:
US Value
(24.7%)
The regional value is compared to the national value.
Prior Value
(20.4%)
Prior Value compares a measured value with the previously measured value. Confidence intervals were not taken into account in determining the direction of the comparison.
Pneumonia Vaccine Ever (Ages 65+) County: Kane
Pneumonia Vaccine Ever (Ages 65+) County: Kane
79.0%
(2018)
Compared to:
IL Value
(69.6%)
The regional value is compared to the Illinois State value.
US Value
(82.7%)
The regional value is compared to the national value.
Prior Value
(71.0%)
Prior Value compares a measured value with the previously measured value. Confidence intervals were not taken into account in determining the direction of the comparison.
Pneumonia Vaccine Ever (Ages 65+) Planning Area: Central
Pneumonia Vaccine Ever (Ages 65+) Planning Area: Central
79.4%
(2018)
Compared to:
US Value
(82.7%)
The regional value is compared to the national value.
Prior Value
(69.4%)
Prior Value compares a measured value with the previously measured value. Confidence intervals were not taken into account in determining the direction of the comparison.
Pneumonia Vaccine Ever (Ages 65+) Planning Area: North
Pneumonia Vaccine Ever (Ages 65+) Planning Area: North
75.8%
(2018)
Compared to:
US Value
(82.7%)
The regional value is compared to the national value.
Prior Value
(71.7%)
Prior Value compares a measured value with the previously measured value. Confidence intervals were not taken into account in determining the direction of the comparison.
Pneumonia Vaccine Ever (Ages 65+) Planning Area: South
Pneumonia Vaccine Ever (Ages 65+) Planning Area: South
82.4%
(2018)
Compared to:
US Value
(82.7%)
The regional value is compared to the national value.
Prior Value
(70.6%)
Prior Value compares a measured value with the previously measured value. Confidence intervals were not taken into account in determining the direction of the comparison.
Health / Immunizations & Infectious Diseases
Pneumonia Vaccine Ever (High Risk Ages 18-64)
Value
Compared to:
Pneumonia Vaccine Ever (High Risk Ages 18-64) County: Kane
Pneumonia Vaccine Ever (High Risk Ages 18-64) County: Kane
32.6%
(2018)
Compared to:
US Value
(39.9%)
The regional value is compared to the national value.
Prior Value
(32.5%)
Prior Value compares a measured value with the previously measured value. Confidence intervals were not taken into account in determining the direction of the comparison.
Pneumonia Vaccine Ever (High Risk Ages 18-64) Planning Area: Central
Pneumonia Vaccine Ever (High Risk Ages 18-64) Planning Area: Central
38.3%
(2018)
Compared to:
US Value
(39.9%)
The regional value is compared to the national value.
Prior Value
(25.9%)
Prior Value compares a measured value with the previously measured value. Confidence intervals were not taken into account in determining the direction of the comparison.
Pneumonia Vaccine Ever (High Risk Ages 18-64) Planning Area: North
Pneumonia Vaccine Ever (High Risk Ages 18-64) Planning Area: North
38.5%
(2018)
Compared to:
US Value
(39.9%)
The regional value is compared to the national value.
Prior Value
(38.7%)
Prior Value compares a measured value with the previously measured value. Confidence intervals were not taken into account in determining the direction of the comparison.
Pneumonia Vaccine Ever (High Risk Ages 18-64) Planning Area: South
Pneumonia Vaccine Ever (High Risk Ages 18-64) Planning Area: South
24.2%
(2018)
Compared to:
US Value
(39.9%)
The regional value is compared to the national value.
Prior Value
(28.2%)
Prior Value compares a measured value with the previously measured value. Confidence intervals were not taken into account in determining the direction of the comparison.
Health / Mental Health & Mental Disorders
"Fair/Poor" Mental Health County: Kane
"Fair/Poor" Mental Health County: Kane
17.8%
(2018)
Compared to:
US Value
(13.0%)
The regional value is compared to the national value.
Prior Value
(10.5%)
Prior Value compares a measured value with the previously measured value. Confidence intervals were not taken into account in determining the direction of the comparison.
"Fair/Poor" Mental Health Planning Area: Central
"Fair/Poor" Mental Health Planning Area: Central
13.7%
(2018)
Compared to:
US Value
(13.0%)
The regional value is compared to the national value.
Prior Value
(6.1%)
Prior Value compares a measured value with the previously measured value. Confidence intervals were not taken into account in determining the direction of the comparison.
"Fair/Poor" Mental Health Planning Area: North
"Fair/Poor" Mental Health Planning Area: North
18.5%
(2018)
Compared to:
US Value
(13.0%)
The regional value is compared to the national value.
Prior Value
(6.6%)
Prior Value compares a measured value with the previously measured value. Confidence intervals were not taken into account in determining the direction of the comparison.
"Fair/Poor" Mental Health Planning Area: South
"Fair/Poor" Mental Health Planning Area: South
18.6%
(2018)
Compared to:
US Value
(13.0%)
The regional value is compared to the national value.
Prior Value
(16.8%)
Prior Value compares a measured value with the previously measured value. Confidence intervals were not taken into account in determining the direction of the comparison.
Diagnosed Depression County: Kane
Diagnosed Depression County: Kane
21.0%
(2018)
Compared to:
IL Value
(16.5%)
The regional value is compared to the Illinois State value.
US Value
(21.6%)
The regional value is compared to the national value.
Prior Value
(11.8%)
Prior Value compares a measured value with the previously measured value. Confidence intervals were not taken into account in determining the direction of the comparison.
Diagnosed Depression Planning Area: Central
Diagnosed Depression Planning Area: Central
22.9%
(2018)
Compared to:
US Value
(21.6%)
The regional value is compared to the national value.
Prior Value
(8.1%)
Prior Value compares a measured value with the previously measured value. Confidence intervals were not taken into account in determining the direction of the comparison.
Diagnosed Depression Planning Area: North
Diagnosed Depression Planning Area: North
19.5%
(2018)
Compared to:
US Value
(21.6%)
The regional value is compared to the national value.
Prior Value
(9.5%)
Prior Value compares a measured value with the previously measured value. Confidence intervals were not taken into account in determining the direction of the comparison.
Diagnosed Depression Planning Area: South
Diagnosed Depression Planning Area: South
21.7%
(2018)
Compared to:
US Value
(21.6%)
The regional value is compared to the national value.
Prior Value
(16.0%)
Prior Value compares a measured value with the previously measured value. Confidence intervals were not taken into account in determining the direction of the comparison.
Health / Oral Health
Dental Visit in the Past Year (Ages 18+) County: Kane
Dental Visit in the Past Year (Ages 18+) County: Kane
72.1%
(2018)
Compared to:
IL Value
(65.5%)
The regional value is compared to the Illinois State value.
US Value
(59.7%)
The regional value is compared to the national value.
Prior Value
(71.6%)
Prior Value compares a measured value with the previously measured value. Confidence intervals were not taken into account in determining the direction of the comparison.
Dental Visit in the Past Year (Ages 18+) Planning Area: Central
Dental Visit in the Past Year (Ages 18+) Planning Area: Central
80.9%
(2018)
Compared to:
US Value
(59.7%)
The regional value is compared to the national value.
Prior Value
(82.9%)
Prior Value compares a measured value with the previously measured value. Confidence intervals were not taken into account in determining the direction of the comparison.
Dental Visit in the Past Year (Ages 18+) Planning Area: North
Dental Visit in the Past Year (Ages 18+) Planning Area: North
72.3%
(2018)
Compared to:
US Value
(59.7%)
The regional value is compared to the national value.
Prior Value
(74.0%)
Prior Value compares a measured value with the previously measured value. Confidence intervals were not taken into account in determining the direction of the comparison.
Dental Visit in the Past Year (Ages 18+) Planning Area: South
Dental Visit in the Past Year (Ages 18+) Planning Area: South
68.5%
(2018)
Compared to:
US Value
(59.7%)
The regional value is compared to the national value.
Prior Value
(64.3%)
Prior Value compares a measured value with the previously measured value. Confidence intervals were not taken into account in determining the direction of the comparison.
Health / Other Conditions
Kidney Disease County: Kane
Kidney Disease County: Kane
1.7%
(2018)
Compared to:
IL Value
(3.7%)
The regional value is compared to the Illinois State value.
US Value
(3.8%)
The regional value is compared to the national value.
Prior Value
(3.4%)
Prior Value compares a measured value with the previously measured value. Confidence intervals were not taken into account in determining the direction of the comparison.
Kidney Disease Planning Area: Central
Kidney Disease Planning Area: Central
1.1%
(2018)
Compared to:
US Value
(3.8%)
The regional value is compared to the national value.
Prior Value
(2.4%)
Prior Value compares a measured value with the previously measured value. Confidence intervals were not taken into account in determining the direction of the comparison.
Kidney Disease Planning Area: North
Kidney Disease Planning Area: North
1.9%
(2018)
Compared to:
US Value
(3.8%)
The regional value is compared to the national value.
Prior Value
(4.7%)
Prior Value compares a measured value with the previously measured value. Confidence intervals were not taken into account in determining the direction of the comparison.
Kidney Disease Planning Area: South
Kidney Disease Planning Area: South
1.8%
(2018)
Compared to:
US Value
(3.8%)
The regional value is compared to the national value.
Prior Value
(2.3%)
Prior Value compares a measured value with the previously measured value. Confidence intervals were not taken into account in determining the direction of the comparison.
Osteoporosis (Ages 50+) County: Kane
Osteoporosis (Ages 50+) County: Kane
7.7%
(2018)
Compared to:
US Value
(9.4%)
The regional value is compared to the national value.
Prior Value
(8.6%)
Prior Value compares a measured value with the previously measured value. Confidence intervals were not taken into account in determining the direction of the comparison.
Osteoporosis (Ages 50+) Planning Area: Central
Osteoporosis (Ages 50+) Planning Area: Central
8.7%
(2018)
Compared to:
US Value
(9.4%)
The regional value is compared to the national value.
Prior Value
(7.5%)
Prior Value compares a measured value with the previously measured value. Confidence intervals were not taken into account in determining the direction of the comparison.
Osteoporosis (Ages 50+) Planning Area: North
Osteoporosis (Ages 50+) Planning Area: North
7.7%
(2018)
Compared to:
US Value
(9.4%)
The regional value is compared to the national value.
Prior Value
(8.8%)
Prior Value compares a measured value with the previously measured value. Confidence intervals were not taken into account in determining the direction of the comparison.
Osteoporosis (Ages 50+) Planning Area: South
Osteoporosis (Ages 50+) Planning Area: South
7.1%
(2018)
Compared to:
US Value
(9.4%)
The regional value is compared to the national value.
Prior Value
(9.0%)
Prior Value compares a measured value with the previously measured value. Confidence intervals were not taken into account in determining the direction of the comparison.
Health / Physical Activity
No Leisure-time Physical Activity County: Kane
No Leisure-time Physical Activity County: Kane
27.7%
(2018)
Compared to:
IL Value
(23.9%)
The regional value is compared to the Illinois State value.
US Value
(26.2%)
The regional value is compared to the national value.
Prior Value
(17.8%)
Prior Value compares a measured value with the previously measured value. Confidence intervals were not taken into account in determining the direction of the comparison.
No Leisure-time Physical Activity Planning Area: Central
No Leisure-time Physical Activity Planning Area: Central
16.8%
(2018)
Compared to:
US Value
(26.2%)
The regional value is compared to the national value.
Prior Value
(14.9%)
Prior Value compares a measured value with the previously measured value. Confidence intervals were not taken into account in determining the direction of the comparison.
No Leisure-time Physical Activity Planning Area: North
No Leisure-time Physical Activity Planning Area: North
30.9%
(2018)
Compared to:
US Value
(26.2%)
The regional value is compared to the national value.
Prior Value
(18.1%)
Prior Value compares a measured value with the previously measured value. Confidence intervals were not taken into account in determining the direction of the comparison.
No Leisure-time Physical Activity Planning Area: South
No Leisure-time Physical Activity Planning Area: South
28.9%
(2018)
Compared to:
US Value
(26.2%)
The regional value is compared to the national value.
Prior Value
(18.5%)
Prior Value compares a measured value with the previously measured value. Confidence intervals were not taken into account in determining the direction of the comparison.
Health / Respiratory Diseases
COPD (Lung Disease) County: Kane
COPD (Lung Disease) County: Kane
8.7%
(2018)
Compared to:
IL Value
(6.2%)
The regional value is compared to the Illinois State value.
US Value
(8.6%)
The regional value is compared to the national value.
Prior Value
(6.5%)
Prior Value compares a measured value with the previously measured value. Confidence intervals were not taken into account in determining the direction of the comparison.
COPD (Lung Disease) Planning Area: Central
COPD (Lung Disease) Planning Area: Central
8.4%
(2018)
Compared to:
US Value
(8.6%)
The regional value is compared to the national value.
Prior Value
(9.1%)
Prior Value compares a measured value with the previously measured value. Confidence intervals were not taken into account in determining the direction of the comparison.
COPD (Lung Disease) Planning Area: North
COPD (Lung Disease) Planning Area: North
8.1%
(2018)
Compared to:
US Value
(8.6%)
The regional value is compared to the national value.
Prior Value
(6.6%)
Prior Value compares a measured value with the previously measured value. Confidence intervals were not taken into account in determining the direction of the comparison.
COPD (Lung Disease) Planning Area: South
COPD (Lung Disease) Planning Area: South
9.3%
(2018)
Compared to:
US Value
(8.6%)
The regional value is compared to the national value.
Prior Value
(5.3%)
Prior Value compares a measured value with the previously measured value. Confidence intervals were not taken into account in determining the direction of the comparison.
Currently Has Asthma (Ages 18+) County: Kane
Currently Has Asthma (Ages 18+) County: Kane
8.0%
(2018)
Compared to:
IL Value
(8.9%)
The regional value is compared to the Illinois State value.
US Value
(11.8%)
The regional value is compared to the national value.
Prior Value
(8.1%)
Prior Value compares a measured value with the previously measured value. Confidence intervals were not taken into account in determining the direction of the comparison.
Currently Has Asthma (Ages 18+) Planning Area: Central
Currently Has Asthma (Ages 18+) Planning Area: Central
8.2%
(2018)
Compared to:
US Value
(11.8%)
The regional value is compared to the national value.
Prior Value
(4.8%)
Prior Value compares a measured value with the previously measured value. Confidence intervals were not taken into account in determining the direction of the comparison.
Currently Has Asthma (Ages 18+) Planning Area: North
Currently Has Asthma (Ages 18+) Planning Area: North
7.4%
(2018)
Compared to:
US Value
(11.8%)
The regional value is compared to the national value.
Prior Value
(8.0%)
Prior Value compares a measured value with the previously measured value. Confidence intervals were not taken into account in determining the direction of the comparison.
Currently Has Asthma (Ages 18+) Planning Area: South
Currently Has Asthma (Ages 18+) Planning Area: South
8.5%
(2018)
Compared to:
US Value
(9.4% in 2014)
The U.S. value is taken from the 2013 PRC National Health Survey; the methodological approach for the national survey is identical to the approach for the 2014 Community Health Needs Assessment in Kane County.
Prior Value
(9.6%)
Prior Value compares a measured value with the previously measured value. Confidence intervals were not taken into account in determining the direction of the comparison.
Health / Tobacco Use
Current Smoker County: Kane
Current Smoker County: Kane
13.7%
(2018)
Compared to:
IL Value
(15.8%)
The regional value is compared to the Illinois State value.
US Value
(11.0%)
The regional value is compared to the national value.
Prior Value
(13.6%)
Prior Value compares a measured value with the previously measured value. Confidence intervals were not taken into account in determining the direction of the comparison.
Current Smoker Planning Area: Central
Current Smoker Planning Area: Central
8.6%
(2018)
Compared to:
US Value
(11.0%)
The regional value is compared to the national value.
Prior Value
(11.4%)
Prior Value compares a measured value with the previously measured value. Confidence intervals were not taken into account in determining the direction of the comparison.
Current Smoker Planning Area: North
Current Smoker Planning Area: North
11.4%
(2018)
Compared to:
US Value
(11.0%)
The regional value is compared to the national value.
Prior Value
(12.6%)
Prior Value compares a measured value with the previously measured value. Confidence intervals were not taken into account in determining the direction of the comparison.
Current Smoker Planning Area: South
Current Smoker Planning Area: South
17.6%
(2018)
Compared to:
US Value
(11.0%)
The regional value is compared to the national value.
Prior Value
(15.7%)
Prior Value compares a measured value with the previously measured value. Confidence intervals were not taken into account in determining the direction of the comparison.
Health / Weight Status
Healthy Weight (BMI 18.5-24.9) County: Kane
Healthy Weight (BMI 18.5-24.9) County: Kane
29.6%
(2018)
Compared to:
IL Value
(32.9%)
The regional value is compared to the Illinois State value.
US Value
(30.3%)
The regional value is compared to the national value.
Prior Value
(32.9%)
Prior Value compares a measured value with the previously measured value. Confidence intervals were not taken into account in determining the direction of the comparison.
Healthy Weight (BMI 18.5-24.9) Planning Area: Central
Healthy Weight (BMI 18.5-24.9) Planning Area: Central
29.9%
(2018)
Compared to:
US Value
(30.3%)
The regional value is compared to the national value.
Prior Value
(29.3%)
Prior Value compares a measured value with the previously measured value. Confidence intervals were not taken into account in determining the direction of the comparison.
Healthy Weight (BMI 18.5-24.9) Planning Area: North
Healthy Weight (BMI 18.5-24.9) Planning Area: North
28.3%
(2018)
Compared to:
US Value
(30.3%)
The regional value is compared to the national value.
Prior Value
(34.4%)
Prior Value compares a measured value with the previously measured value. Confidence intervals were not taken into account in determining the direction of the comparison.
Healthy Weight (BMI 18.5-24.9) Planning Area: South
Healthy Weight (BMI 18.5-24.9) Planning Area: South
30.8%
(2018)
Compared to:
US Value
(30.3%)
The regional value is compared to the national value.
Prior Value
(32.5%)
Prior Value compares a measured value with the previously measured value. Confidence intervals were not taken into account in determining the direction of the comparison.
Obese (BMI 30+) County: Kane
Obese (BMI 30+) County: Kane
31.9%
(2018)
Compared to:
IL Value
(31.6%)
The regional value is compared to the Illinois State value.
US Value
(32.8%)
The regional value is compared to the national value.
Prior Value
(28.5%)
Prior Value compares a measured value with the previously measured value. Confidence intervals were not taken into account in determining the direction of the comparison.
Obese (BMI 30+) Planning Area: Central
Obese (BMI 30+) Planning Area: Central
31.1%
(2018)
Compared to:
US Value
(29.0% in 2014)
The U.S. value is taken from the 2013 PRC National Health Survey; the methodological approach for the national survey is identical to the approach for the 2014 Community Health Needs Assessment in Kane County.
Prior Value
(24.5%)
Prior Value compares a measured value with the previously measured value. Confidence intervals were not taken into account in determining the direction of the comparison.
Obese (BMI 30+) Planning Area: North
Obese (BMI 30+) Planning Area: North
34.4%
(2018)
Compared to:
US Value
(29.0% in 2014)
The U.S. value is taken from the 2013 PRC National Health Survey; the methodological approach for the national survey is identical to the approach for the 2014 Community Health Needs Assessment in Kane County.
Prior Value
(25.1%)
Prior Value compares a measured value with the previously measured value. Confidence intervals were not taken into account in determining the direction of the comparison.
Obese (BMI 30+) Planning Area: South
Obese (BMI 30+) Planning Area: South
30.0%
(2018)
Compared to:
US Value
(29.0% in 2014)
The U.S. value is taken from the 2013 PRC National Health Survey; the methodological approach for the national survey is identical to the approach for the 2014 Community Health Needs Assessment in Kane County.
Prior Value
(34.5%)
Prior Value compares a measured value with the previously measured value. Confidence intervals were not taken into account in determining the direction of the comparison.
Overweight (BMI 25+) County: Kane
Overweight (BMI 25+) County: Kane
67.8%
(2018)
Compared to:
IL Value
(65.0%)
The regional value is compared to the Illinois State value.
US Value
(67.8%)
The regional value is compared to the national value.
Prior Value
(65.6%)
Prior Value compares a measured value with the previously measured value. Confidence intervals were not taken into account in determining the direction of the comparison.
Overweight (BMI 25+) Planning Area: Central
Overweight (BMI 25+) Planning Area: Central
67.7%
(2018)
Compared to:
US Value
(67.8%)
The regional value is compared to the national value.
Prior Value
(69.0%)
Prior Value compares a measured value with the previously measured value. Confidence intervals were not taken into account in determining the direction of the comparison.
Overweight (BMI 25+) Planning Area: North
Overweight (BMI 25+) Planning Area: North
69.0%
(2018)
Compared to:
US Value
(67.8%)
The regional value is compared to the national value.
Prior Value
(63.6%)
Prior Value compares a measured value with the previously measured value. Confidence intervals were not taken into account in determining the direction of the comparison.
Overweight (BMI 25+) Planning Area: South
Overweight (BMI 25+) Planning Area: South
66.9%
(2018)
Compared to:
US Value
(67.8%)
The regional value is compared to the national value.
Prior Value
(66.9%)
Prior Value compares a measured value with the previously measured value. Confidence intervals were not taken into account in determining the direction of the comparison.
Health / Wellness & Lifestyle
"Fair/Poor" Physical Health County: Kane
"Fair/Poor" Physical Health County: Kane
14.7%
(2018)
Compared to:
IL Value
(18.0%)
The regional value is compared to the Illinois State value.
US Value
(18.1%)
The regional value is compared to the national value.
Prior Value
(15.7%)
Prior Value compares a measured value with the previously measured value. Confidence intervals were not taken into account in determining the direction of the comparison.
"Fair/Poor" Physical Health Planning Area: Central
"Fair/Poor" Physical Health Planning Area: Central
6.9%
(2018)
Compared to:
US Value
(18.1%)
The regional value is compared to the national value.
Prior Value
(7.6%)
Prior Value compares a measured value with the previously measured value. Confidence intervals were not taken into account in determining the direction of the comparison.
"Fair/Poor" Physical Health Planning Area: North
"Fair/Poor" Physical Health Planning Area: North
18.4%
(2018)
Compared to:
US Value
(18.1%)
The regional value is compared to the national value.
Prior Value
(12.9%)
Prior Value compares a measured value with the previously measured value. Confidence intervals were not taken into account in determining the direction of the comparison.
"Fair/Poor" Physical Health Planning Area: South
"Fair/Poor" Physical Health Planning Area: South
14.3%
(2018)
Compared to:
US Value
(18.1%)
The regional value is compared to the national value.
Prior Value
(22.0%)
Prior Value compares a measured value with the previously measured value. Confidence intervals were not taken into account in determining the direction of the comparison.
