Search for Indicators
Behavioral Health
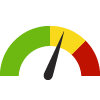
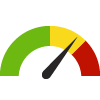
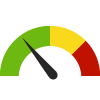
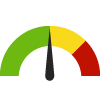
Indicator Gauge Icon Legend
Legend Colors
Red is bad, green is good, blue is not statistically different/neutral.
Compared to Distribution
 the value is in the best half of communities.
 the value is in the 2nd worst quarter of communities.
 the value is in the worst quarter of communities.
Compared to Target
 meets target;
  does not meet target.
Compared to a Single Value
 lower than the comparison value;
 higher than the comparison value;
 not statistically different from comparison value.
Trend

 non-significant change over time;
 significant change over time;
  no change over time.
Compared to Prior Value
 higher than the previous measurement period;
 lower than the previous measurement period;
 no statistically different change from previous measurement period.
County: Kane
Health / Alcohol & Drug Use
Value
Compared to:
County: Kane Adults who Binge Drink
County: Kane Adults who Binge Drink
16.5%
(2021)
Compared to:

IL Counties
The distribution is based on data from 102 Illinois counties.
U.S. Counties
The distribution is based on data from 3,074 U.S. counties and county equivalents.
US Value
(15.5%)
The regional value is compared to the national value.
15.9
Deaths per 100,000 population
(2018-2020)
Compared to:
U.S. Counties
The distribution is based on data from 1,303 U.S. counties and county equivalents.
IL Value
(23.6)
The regional value is compared to the Illinois State value.
US Value
(23.5)
The regional value is compared to the national value.
Prior Value
(16.5)
Prior Value compares a measured value with the previously measured value. Confidence intervals were taken into account in determining the direction of the comparison.
County: Kane Age-Adjusted Drug Overdose Mortality Rate
County: Kane Age-Adjusted Drug Overdose Mortality Rate
17.9
Per 100,000 population
(2020)
Compared to:

Prior Value
(15.0)
Prior Value compares a measured value with the previously measured value. Confidence intervals were taken into account in determining the direction of the comparison.
Trend
This comparison measures the indicator’s values over multiple time periods.<br>The Mann-Kendall Test for Statistical Significance is used to evaluate the trend<br>over 4 to 10 periods of measure, subject to data availability and comparability.
County: Kane Age-Adjusted Opioid-Related Overdose Mortality Rate
County: Kane Age-Adjusted Opioid-Related Overdose Mortality Rate
15.1
Per 100,000 population
(2020)
Compared to:
Prior Value
(11.8)
Prior Value compares a measured value with the previously measured value. Confidence intervals were taken into account in determining the direction of the comparison.
Trend
This comparison measures the indicator’s values over multiple time periods.<br>The Mann-Kendall Test for Statistical Significance is used to evaluate the trend<br>over 4 to 10 periods of measure, subject to data availability and comparability.
County: Kane Alcohol-Impaired Driving Deaths
County: Kane Alcohol-Impaired Driving Deaths
25.3%
Percent of driving deaths with alcohol involvement
(2017-2021)
Compared to:
IL Counties
The distribution is based on data from 101 Illinois counties.
U.S. Counties
The distribution is based on data from 3,116 U.S. counties and county equivalents.
IL Value
(27.9%)
The regional value is compared to the Illinois State value.
US Value
(26.3%)
The regional value is compared to the national value.
Prior Value
(29.8%)
Prior Value compares a measured value with the previously measured value. Confidence intervals were taken into account in determining the direction of the comparison.
Trend
This comparison measures the indicator’s values over multiple time periods.<br>The Mann-Kendall Test for Statistical Significance is used to evaluate the trend<br>over 4 to 10 periods of measure, subject to data availability and comparability.
County: Kane Binge Drinker
County: Kane Binge Drinker
26.5%
(2018)
Compared to:

IL Value
(19.9%)
The regional value is compared to the Illinois State value.
US Value
(20.0%)
The regional value is compared to the national value.
Prior Value
(16.2%)
Prior Value compares a measured value with the previously measured value. Confidence intervals were not taken into account in determining the direction of the comparison.
County: Kane Chronic Drinker
County: Kane Chronic Drinker
3.7%
(2014)
Compared to:
US Value
(5.2%)
The U.S. value is taken from the 2013 PRC National Health Survey; the methodological approach for the national survey is identical to the approach for the 2014 Community Health Needs Assessment in Kane County.
County: Kane Crude Drug Overdose Mortality Rate
County: Kane Crude Drug Overdose Mortality Rate
18.8
Per 100,000 population
(2020-2022)
Compared to:
Prior Value
(15.2)
Prior Value compares a measured value with the previously measured value. Confidence intervals were taken into account in determining the direction of the comparison.
Trend
This comparison measures the indicator’s values over multiple time periods.<br>The Mann-Kendall Test for Statistical Significance is used to evaluate the trend<br>over 4 to 10 periods of measure, subject to data availability and comparability.
County: Kane Crude Opioid Overdose Mortality Rate
County: Kane Crude Opioid Overdose Mortality Rate
14.7
Per 100,000 population
(2020-2022)
Compared to:
Prior Value
(12.1)
Prior Value compares a measured value with the previously measured value. Confidence intervals were taken into account in determining the direction of the comparison.
Trend
This comparison measures the indicator’s values over multiple time periods.<br>The Mann-Kendall Test for Statistical Significance is used to evaluate the trend<br>over 4 to 10 periods of measure, subject to data availability and comparability.
County: Kane Current Drinker
County: Kane Current Drinker
65.0%
(2018)
Compared to:
US Value
(56.5% in 2014)
The U.S. value is taken from the 2013 PRC National Health Survey; the methodological approach for the national survey is identical to the approach for the 2014 Community Health Needs Assessment in Kane County.
Prior Value
(61.9%)
Prior Value compares a measured value with the previously measured value. Confidence intervals were not taken into account in determining the direction of the comparison.
County: Kane Death Rate due to Drug Poisoning
County: Kane Death Rate due to Drug Poisoning
17.7
Deaths per 100,000 population
(2019-2021)
Compared to:
IL Counties
The distribution is based on data from 60 Illinois counties.
U.S. Counties
The distribution is based on data from 1,899 U.S. counties and county equivalents.
IL Value
(26.6)
The regional value is compared to the Illinois State value.
US Value
(27.2)
The regional value is compared to the national value.
HP 2030 Target
(20.7)
<div>SU-03: Reduce drug overdose deaths <strong>(LEADING HEALTH INDICATOR)</strong></div>
County: Kane Drinking and Driving in the Past Month
County: Kane Drinking and Driving in the Past Month
7.8%
(2018)
Compared to:
IL Value
(3.8%)
The regional value is compared to the Illinois State value.
US Value
(5.2%)
The regional value is compared to the national value.
Prior Value
(1.4%)
Prior Value compares a measured value with the previously measured value. Confidence intervals were not taken into account in determining the direction of the comparison.
County: Kane Health Behaviors Ranking
County: Kane Health Behaviors Ranking
6
(2023)
Compared to:
IL Counties
The distribution is based on data from 102 Illinois counties.
County: Kane Liquor Store Density
County: Kane Liquor Store Density
12.2
Stores per 100,000 population
(2021)
Compared to:
IL Counties
(2016)
The distribution is based on data from 86 Illinois counties.
U.S. Counties
The distribution is based on data from 1,477 U.S. counties and county equivalents.
IL Value
(11.2)
The regional value is compared to the Illinois State value.
US Value
(10.7)
The regional value is compared to the national value.
Prior Value
(12.4)
Prior Value compares a measured value with the previously measured value. Confidence intervals were not taken into account in determining the direction of the comparison.
Trend
This comparison measures the indicator’s values over multiple time periods.<br>The Mann-Kendall Test for Statistical Significance is used to evaluate the trend<br>over 4 to 10 periods of measure, subject to data availability and comparability.
County: Kane Mothers who Smoked During Pregnancy
County: Kane Mothers who Smoked During Pregnancy
4.0%
(2008)
Compared to:
IL Counties
The distribution is based on data from 98 Illinois counties.
IL Value
(7.9%)
The regional value is compared to the Illinois State value.
US Value
(9.7%)
The regional value is compared to the national value. The source for the national value is Centers for Disease Control and Prevention
Prior Value
(4.3%)
Prior Value compares a measured value with the previously measured value. Confidence intervals were not taken into account in determining the direction of the comparison.
Trend
This comparison measures the indicator’s values over multiple time periods.<br>The Mann-Kendall Test for Statistical Significance is used to evaluate the trend<br>over 4 to 10 periods of measure, subject to data availability and comparability.
HP 2030 Target
(4.3%)
County: Kane Rate of All Drug Seizures
County: Kane Rate of All Drug Seizures
7,599.4
Grams per 100,000 population
(2013)
Compared to:
Prior Value
(8,886.9)
Prior Value compares a measured value with the previously measured value. Confidence intervals were not taken into account in determining the direction of the comparison.
Trend
This comparison measures the indicator’s values over multiple time periods.<br>The Mann-Kendall Test for Statistical Significance is used to evaluate the trend<br>over 4 to 10 periods of measure, subject to data availability and comparability.
County: Kane Rate of Cannabis Drug Seizures
County: Kane Rate of Cannabis Drug Seizures
5,504.3
Grams per 100,000 population
(2013)
Compared to:
Prior Value
(8,340.6)
Prior Value compares a measured value with the previously measured value. Confidence intervals were not taken into account in determining the direction of the comparison.
Trend
This comparison measures the indicator’s values over multiple time periods.<br>The Mann-Kendall Test for Statistical Significance is used to evaluate the trend<br>over 4 to 10 periods of measure, subject to data availability and comparability.
County: Kane Rate of Cocaine Drug Seizures
County: Kane Rate of Cocaine Drug Seizures
1,749.4
Grams per 100,000 population
(2013)
Compared to:
Prior Value
(440.5)
Prior Value compares a measured value with the previously measured value. Confidence intervals were not taken into account in determining the direction of the comparison.
Trend
This comparison measures the indicator’s values over multiple time periods.<br>The Mann-Kendall Test for Statistical Significance is used to evaluate the trend<br>over 4 to 10 periods of measure, subject to data availability and comparability.
County: Kane Rate of Crack Cocaine Drug Seizures
County: Kane Rate of Crack Cocaine Drug Seizures
0.0
Grams per 100,000 population
(2012)
Compared to:
Prior Value
(0.5)
Prior Value compares a measured value with the previously measured value. Confidence intervals were not taken into account in determining the direction of the comparison.
Trend
This comparison measures the indicator’s values over multiple time periods.<br>The Mann-Kendall Test for Statistical Significance is used to evaluate the trend<br>over 4 to 10 periods of measure, subject to data availability and comparability.
County: Kane Rate of Heroin Drug Seizures
County: Kane Rate of Heroin Drug Seizures
15.0
Grams per 100,000 population
(2013)
Compared to:
Prior Value
(17.3)
Prior Value compares a measured value with the previously measured value. Confidence intervals were not taken into account in determining the direction of the comparison.
Trend
This comparison measures the indicator’s values over multiple time periods.<br>The Mann-Kendall Test for Statistical Significance is used to evaluate the trend<br>over 4 to 10 periods of measure, subject to data availability and comparability.
County: Kane Rate of Methamphetamine Drug Seizures
County: Kane Rate of Methamphetamine Drug Seizures
172.4
Grams per 100,000 population
(2013)
Compared to:

Prior Value
(87.1)
Prior Value compares a measured value with the previously measured value. Confidence intervals were not taken into account in determining the direction of the comparison.
Trend
This comparison measures the indicator’s values over multiple time periods.<br>The Mann-Kendall Test for Statistical Significance is used to evaluate the trend<br>over 4 to 10 periods of measure, subject to data availability and comparability.
County: Kane Teens who Use Alcohol
County: Kane Teens who Use Alcohol
25%
(2022)
Compared to:
IL Counties
(2018)
The distribution is based on data from 77 Illinois counties.
IL Value
(40% in 2018)
The regional value is compared to the Illinois State value.
Prior Value
(46%)
Prior Value compares a measured value with the previously measured value. Confidence intervals were not taken into account in determining the direction of the comparison.
Trend
This comparison measures the indicator’s values over multiple time periods.<br>The Mann-Kendall Test for Statistical Significance is used to evaluate the trend<br>over 4 to 10 periods of measure, subject to data availability and comparability.
County: Kane Teens who Use Marijuana
County: Kane Teens who Use Marijuana
13%
(2022)
Compared to:
IL Counties
(2018)
The distribution is based on data from 77 Illinois counties.
IL Value
(26% in 2018)
The regional value is compared to the Illinois State value.
Prior Value
(24%)
Prior Value compares a measured value with the previously measured value. Confidence intervals were not taken into account in determining the direction of the comparison.
Trend
This comparison measures the indicator’s values over multiple time periods.<br>The Mann-Kendall Test for Statistical Significance is used to evaluate the trend<br>over 4 to 10 periods of measure, subject to data availability and comparability.
County: Kane
Health / Mental Health & Mental Disorders
Value
Compared to:
County: Kane "Fair/Poor" Mental Health
County: Kane "Fair/Poor" Mental Health
17.8%
(2018)
Compared to:
US Value
(13.0%)
The regional value is compared to the national value.
Prior Value
(10.5%)
Prior Value compares a measured value with the previously measured value. Confidence intervals were not taken into account in determining the direction of the comparison.
County: Kane Adults Ever Diagnosed with Depression
County: Kane Adults Ever Diagnosed with Depression
17.6%
(2021)
Compared to:
IL Counties
The distribution is based on data from 102 Illinois counties.
U.S. Counties
The distribution is based on data from 3,074 U.S. counties and county equivalents.
US Value
(19.5%)
The regional value is compared to the national value.
County: Kane Age-Adjusted Death Rate due to Alzheimer's Disease
County: Kane Age-Adjusted Death Rate due to Alzheimer's Disease
16.8
Deaths per 100,000 population
(2018-2020)
Compared to:
IL Counties
The distribution is based on data from 72 Illinois counties.
U.S. Counties
The distribution is based on data from 2,140 U.S. counties and county equivalents.
IL Value
(26.2)
The regional value is compared to the Illinois State value.
US Value
(31.0)
The regional value is compared to the national value.
Prior Value
(16.4)
Prior Value compares a measured value with the previously measured value. Confidence intervals were taken into account in determining the direction of the comparison.
Trend
This comparison measures the indicator’s values over multiple time periods.<br>The Mann-Kendall Test for Statistical Significance is used to evaluate the trend<br>over 4 to 10 periods of measure, subject to data availability and comparability.
County: Kane Age-Adjusted Death Rate due to Suicide
County: Kane Age-Adjusted Death Rate due to Suicide
9.1
Deaths per 100,000 population
(2018-2020)
Compared to:
U.S. Counties
The distribution is based on data from 1,307 U.S. counties and county equivalents.
IL Value
(10.9)
The regional value is compared to the Illinois State value.
US Value
(13.9)
The regional value is compared to the national value.
Prior Value
(8.8)
Prior Value compares a measured value with the previously measured value. Confidence intervals were taken into account in determining the direction of the comparison.
Trend
This comparison measures the indicator’s values over multiple time periods.<br>The Mann-Kendall Test for Statistical Significance is used to evaluate the trend<br>over 4 to 10 periods of measure, subject to data availability and comparability.
HP 2030 Target
(12.8)
<div>MHMD-01: Reduce the suicide rate <strong>(LEADING HEALTH INDICATOR)</strong></div>
County: Kane Alzheimer's Disease or Dementia: Medicare Population
County: Kane Alzheimer's Disease or Dementia: Medicare Population
6.0%
(2022)
Compared to:

IL Counties
The distribution is based on data from 102 Illinois counties.
U.S. Counties
The distribution is based on data from 3,129 U.S. counties and county equivalents.
IL Value
(7.0%)
The regional value is compared to the Illinois State value.
US Value
(6.0%)
The regional value is compared to the national value.
Prior Value
(7.0%)
Prior Value compares a measured value with the previously measured value. Confidence intervals were not taken into account in determining the direction of the comparison.
Trend
This comparison measures the indicator’s values over multiple time periods.<br>The Mann-Kendall Test for Statistical Significance is used to evaluate the trend<br>over 4 to 10 periods of measure, subject to data availability and comparability.
County: Kane Depression: Medicare Population
County: Kane Depression: Medicare Population
17.0%
(2022)
Compared to:
IL Counties
The distribution is based on data from 102 Illinois counties.
U.S. Counties
The distribution is based on data from 3,129 U.S. counties and county equivalents.
IL Value
(15.0%)
The regional value is compared to the Illinois State value.
US Value
(16.0%)
The regional value is compared to the national value.
Prior Value
(16.0%)
Prior Value compares a measured value with the previously measured value. Confidence intervals were not taken into account in determining the direction of the comparison.
Trend
This comparison measures the indicator’s values over multiple time periods.<br>The Mann-Kendall Test for Statistical Significance is used to evaluate the trend<br>over 4 to 10 periods of measure, subject to data availability and comparability.
County: Kane Diagnosed Depression
County: Kane Diagnosed Depression
21.0%
(2018)
Compared to:
IL Value
(16.5%)
The regional value is compared to the Illinois State value.
US Value
(21.6%)
The regional value is compared to the national value.
Prior Value
(11.8%)
Prior Value compares a measured value with the previously measured value. Confidence intervals were not taken into account in determining the direction of the comparison.
County: Kane Emergency Department Visits for Behavioral Health
County: Kane Emergency Department Visits for Behavioral Health
128.3
Per 10,000 population
(2018-2020)
Compared to:
IL Counties
The distribution is based on data from 102 Illinois counties.
IL Value
(122.5)
The regional value is compared to the Illinois State value.
Prior Value
(142.2)
Prior Value compares a measured value with the previously measured value. Confidence intervals were not taken into account in determining the direction of the comparison.
County: Kane Frequent Mental Distress
County: Kane Frequent Mental Distress
12.4%
(2019)
Compared to:
IL Counties
The distribution is based on data from 102 Illinois counties.
U.S. Counties
The distribution is based on data from 3,121 U.S. counties and county equivalents.
IL Value
(12.7%)
The regional value is compared to the Illinois State value.
US Value
(14.0%)
The regional value is compared to the national value.
Prior Value
(12.3%)
Prior Value compares a measured value with the previously measured value. Confidence intervals were taken into account in determining the direction of the comparison.
County: Kane Mental Health Provider Rate
County: Kane Mental Health Provider Rate
365
Providers per 100,000 population
(2023)
Compared to:
IL Counties
The distribution is based on data from 97 Illinois counties.
U.S. Counties
The distribution is based on data from 2,956 U.S. counties and county equivalents.
IL Value
(315)
The regional value is compared to the Illinois State value.
Prior Value
(337)
Prior Value compares a measured value with the previously measured value. Confidence intervals were not taken into account in determining the direction of the comparison.
Trend
This comparison measures the indicator’s values over multiple time periods.<br>The Mann-Kendall Test for Statistical Significance is used to evaluate the trend<br>over 4 to 10 periods of measure, subject to data availability and comparability.
County: Kane Persons with a Cognitive Difficulty
County: Kane Persons with a Cognitive Difficulty
3.5%
(2018-2022)
Compared to:


IL Value
(4.5%)
The regional value is compared to the Illinois State value.
US Value
(5.3%)
The regional value is compared to the national value.
Trend
This comparison measures the indicator’s values over multiple time periods.<br>The Mann-Kendall Test for Statistical Significance is used to evaluate the trend<br>over 4 to 10 periods of measure, subject to data availability and comparability.
County: Kane Poor Mental Health Days
County: Kane Poor Mental Health Days
34.5%
(2015-2019)
Compared to:
IL Counties
The distribution is based on data from 76 Illinois counties.
IL Value
(36.7% in 2021)
The regional value is compared to the Illinois State value.
Prior Value
(40.5%)
Prior Value compares a measured value with the previously measured value. Confidence intervals were not taken into account in determining the direction of the comparison.
County: Kane Poor Mental Health: 14+ Days
County: Kane Poor Mental Health: 14+ Days
13.9%
(2021)
Compared to:
IL Counties
The distribution is based on data from 102 Illinois counties.
U.S. Counties
The distribution is based on data from 3,074 U.S. counties and county equivalents.
US Value
(14.7%)
The regional value is compared to the national value.
County: Kane
Health / Tobacco Use
Value
Compared to:
County: Kane Adults who Smoke
County: Kane Adults who Smoke
13.3%
(2021)
Compared to:
IL Counties
The distribution is based on data from 102 Illinois counties.
U.S. Counties
The distribution is based on data from 3,074 U.S. counties and county equivalents.
US Value
(13.5%)
The regional value is compared to the national value.
HP 2030 Target
(6.1%)
<div>TU-02: Reduce current cigarette smoking in adults <strong>(LEADING HEALTH INDICATOR)</strong></div>
County: Kane Current Smoker
County: Kane Current Smoker
13.7%
(2018)
Compared to:
IL Value
(15.8%)
The regional value is compared to the Illinois State value.
US Value
(11.0%)
The regional value is compared to the national value.
Prior Value
(13.6%)
Prior Value compares a measured value with the previously measured value. Confidence intervals were not taken into account in determining the direction of the comparison.
County: Kane Lung and Bronchus Cancer Incidence Rate
County: Kane Lung and Bronchus Cancer Incidence Rate
46.7
Cases per 100,000 population
(2016-2020)
Compared to:
IL Counties
The distribution is based on data from 102 Illinois counties.
U.S. Counties
The distribution is based on data from 2,471 U.S. counties and county equivalents.
IL Value
(59.3)
The regional value is compared to the Illinois State value.
US Value
(54.0)
The regional value is compared to the national value.
Prior Value
(47.9)
Prior Value compares a measured value with the previously measured value. Confidence intervals were taken into account in determining the direction of the comparison.
Trend
This comparison measures the indicator’s values over multiple time periods.<br>The Mann-Kendall Test for Statistical Significance is used to evaluate the trend<br>over 4 to 10 periods of measure, subject to data availability and comparability.
County: Kane Teens who Smoke
County: Kane Teens who Smoke
1%
(2022)
Compared to:
IL Counties
(2018)
The distribution is based on data from 77 Illinois counties.
IL Value
(5% in 2018)
The regional value is compared to the Illinois State value.
Prior Value
(4%)
Prior Value compares a measured value with the previously measured value. Confidence intervals were not taken into account in determining the direction of the comparison.
Trend
This comparison measures the indicator’s values over multiple time periods.<br>The Mann-Kendall Test for Statistical Significance is used to evaluate the trend<br>over 4 to 10 periods of measure, subject to data availability and comparability.
